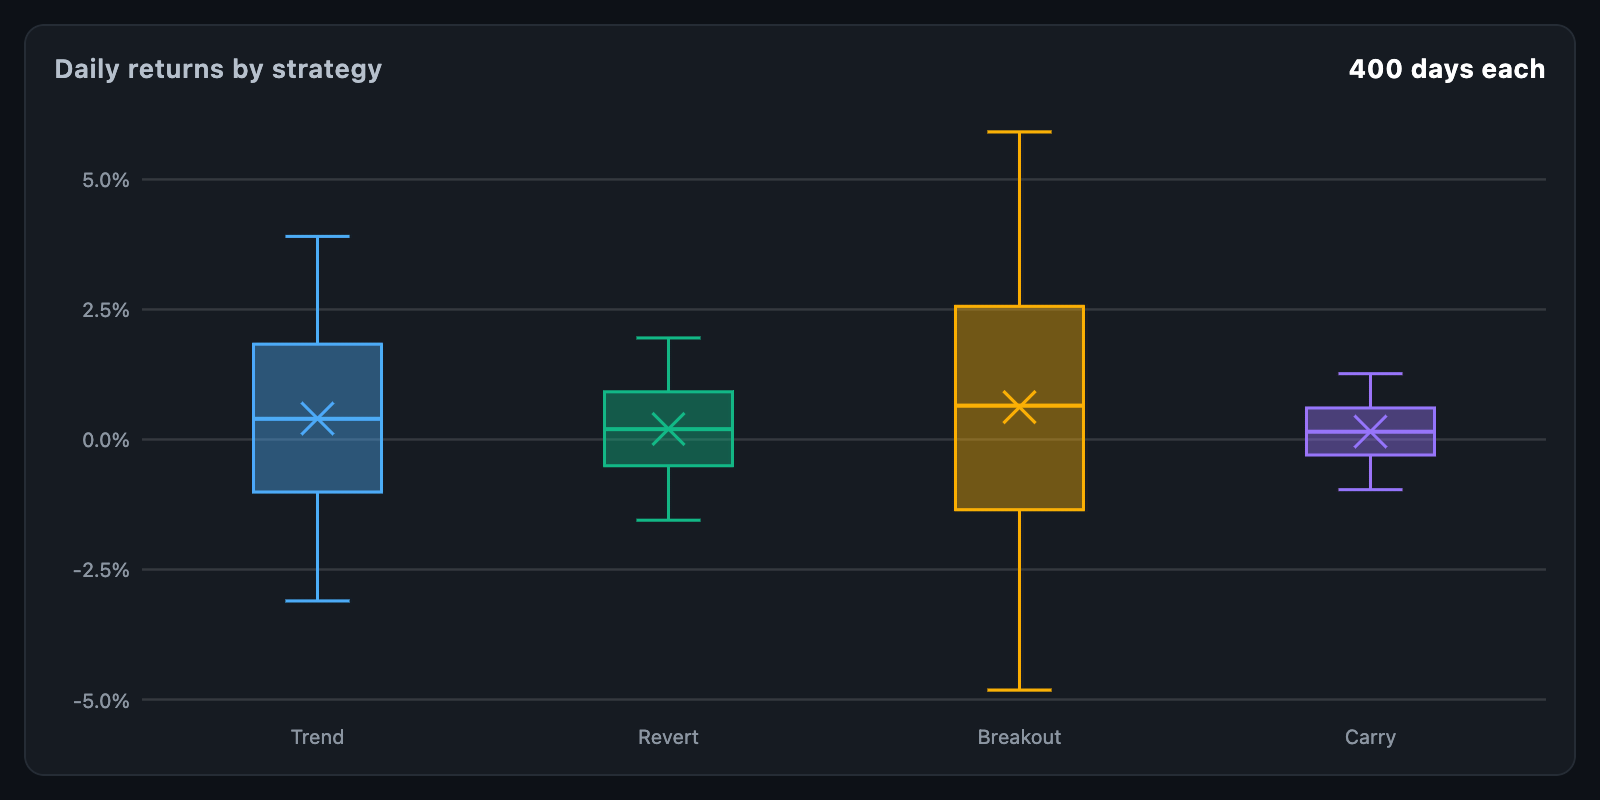
BoxPlotChart compares the spread of several sets of numbers side by side. Each
entry is drawn as a box from the first to the third quartile, a line at the
median, whiskers out to the furthest ordinary value, and a point for every
outlier. Typical uses include comparing strategy returns, daily ranges across
symbols and latency distributions.
BoxPlotChart(
  entries: [
    BoxPlotEntry.fromSamples(trendReturns, label: 'Trend'),
    BoxPlotEntry.fromSamples(reversionReturns, label: 'Reversion'),
  ],
);
The chart fills its constraints. When the height is unbounded, it uses
defaultHeight.
BoxPlotStats.fromSamples(values, whisker: 1.5) does the statistics:
- Quartiles are read off the sorted samples by linear interpolation — the method spreadsheets and NumPy use.
- The whiskers reach the furthest sample still within
whiskerinterquartile ranges of the box; everything past them becomes an outlier. whisker: double.infinitykeeps every sample inside the whiskers and reports no outliers.- Values that are not finite are ignored.
BoxPlotStats can also be built directly from numbers already worked out, with
lower, q1, median, q3, upper and optionally mean and outliers. It
exposes iqr, min and max (the last two including outliers).
BoxPlotEntry.fromSamples(values, label: …) is the shorthand that summarises and
wraps in one step.
| Parameter | Description |
|---|---|
min, max |
Ends of the value axis; null reads them off the entries, with 5% padding |
boxWidthFraction |
How much of its column a box takes (default 0.6) |
maxBoxWidth |
The widest a box is drawn (default 64) |
labelHeight |
Room under the boxes for entry names; 0 writes none |
axisWidth, showAxis |
The value axis down the left |
tickCount |
About how many value ticks to write |
padding |
Space around the chart |
boxPlotRange(entries) returns the range the chart would pick,
layOutBoxPlot(entries, bounds, min: …, max: …) returns the BoxPlotBox list it
paints, and boxPlotBoxAt hit-tests it. All three are public, so a layout can be
computed and tested without a widget.
| Parameter | Description |
|---|---|
palette |
Colours taken in turn by entries without one |
fillOpacity |
How opaque a box's fill is; the outline is solid |
strokeWidth, medianWidth |
Line weights |
showMean |
Marks the mean with a cross when an entry reports one |
outlierRadius |
Size of an outlier point |
whiskerCapFraction |
Width of a whisker cap, as a share of the box width |
gridColor |
Line ruled across the chart at each tick; null rules none |
hoverColor |
Painted behind the column under the pointer |
valueFormatter |
Formats axis values (default: at most two decimals) |
axisLabelStyle, entryLabelStyle |
Text styles |
backgroundColor |
Painted behind the chart |
A touch anywhere in an entry's column selects it — the boxes themselves are
often too narrow to hit. onTouch reports a BoxPlotTouchDetails with the
box, the entry and its stats, and null when the pointer leaves.
BoxPlotChart(
  entries: entries,
  tooltipBuilder: (context, details) => Card(
    child: Padding(
      padding: const EdgeInsets.all(8),
      child: Text('median ${details.stats.median}\n'
          'IQR ${details.stats.iqr}'),
    ),
  ),
);animationDuration grows the boxes out of their median lines; animationCurve
eases it and animateOnMount controls whether the first build animates. The
chart animates again whenever entries changes identity.